

Your CRM and Web Analytics in One Dashboard
Pipeline metrics and marketing analytics, combined in one live dashboard. Built and maintained for you.
Stop exporting CSVs from your CRM and your analytics tool and stitching them into a spreadsheet every month. Pipeline Connect builds you a single dashboard that pulls your Pipeline CRM pipeline and your web analytics into one shared view, and keeps it current on a schedule. We build it and keep it current for you, so there is no separate BI tool for you to buy or maintain.
✓ Rolling out now, in development ✓ Talk to us to scope yours ✓ Part of Pipeline Connect
At a Glance
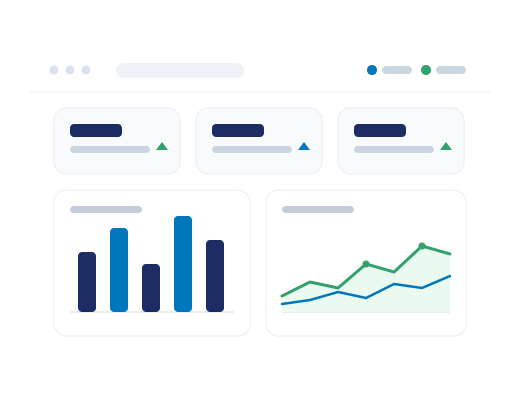
The reporting dashboard brings your Pipeline CRM data together with your web analytics in a single live view you can share with your team. Instead of pulling pipeline numbers from your CRM, traffic and lead numbers from your analytics tool, and stitching them into a spreadsheet every month, your metrics land in one dashboard that refreshes on a schedule. We build and maintain it for you, so there’s no separate BI tool to buy and nothing for you to keep running. This is different from Pipeline CRM’s built-in reports: it combines your CRM with outside sources like web analytics in one place. We’re rolling this out now as part of Pipeline Connect, our managed integration add-on. Talk to us to scope your dashboard and get early access.
Rebuild the report every month, or open one link
The clearest way to see what a managed dashboard is worth: the monthly grind it deletes, next to what it makes automatic.
Doing it by hand
Every reporting cycle
- Pull pipeline numbers out of Pipeline CRM
- Log into your analytics tool for traffic and leads
- Export both to CSV
- Paste it all into a spreadsheet and rebuild the charts
- Do it again next month, and hope nothing shifted
hours each cycle · stale on arrival · manual charts
With Pipeline Connect
You open one link. It’s already current
- CRM pipeline and web analytics in one dashboard
- Refreshes on a schedule, so it stays current on its own
- Shareable link for your team, no logins to juggle
- No CSV exports and no charts to rebuild
- Monitored and maintained for you
one link · always current · nothing to rebuild
Three steps to your dashboard
Scope
Tell us the metrics that matter, from pipeline and activity to lead sources and web traffic, and which sources to include.
Build & test
We connect Pipeline CRM and your web analytics, build the dashboard, and set it to refresh on a schedule so it stays current on its own.
Go live
You get a single shareable dashboard link. Because we scope each dashboard to your metrics, we confirm the timeline when we scope yours.
What you’ll need to get started
Most teams already have everything below. Here’s how the responsibility splits between you and the Pipeline CRM team.
You provide
- An active Pipeline CRM account with API access, so we can pull your pipeline metrics
- Access to any source you want in it, for example your web analytics property
- ~15 minutes to share the metrics that matter and connect access
We handle
- Connecting Pipeline CRM and your analytics sources into one data store
- Scheduled data pulls so the dashboard refreshes on its own
- Building the dashboard, laid out around your metrics
- The refresh schedule and testing so the numbers reconcile before you rely on them
- Ongoing monitoring and maintenance, with fixes if a source changes on its side
Your pipeline and your marketing, side by side
Your data refreshes on a schedule, so the dashboard is current whenever you open it. You export nothing and touch no spreadsheet.
On a schedule
Your data refreshes on its own
No exports to run, no charts to rebuild, no logins to juggle.
The starter dashboard combines Pipeline CRM with one web-analytics source. Here’s the kind of thing it shows, and how each source refreshes.
| Source | Example metrics in your dashboard | Refresh |
|---|---|---|
| Pipeline CRM | Deals created, pipeline value by stage, win rate, activities logged | On a schedule |
| Web analytics (GA4) | Sessions, leads and conversions, traffic by channel | On a schedule |
| Your team | One shared dashboard we build and keep current, no separate BI tool to manage | Always current |
Who runs a combined CRM and marketing dashboard
Scenario 1: Sales manager rebuilding the same board slide every month
The situation: A sales manager spends the first morning of every month exporting pipeline numbers from Pipeline CRM, pulling traffic and lead figures from analytics, and rebuilding the same board slide in a spreadsheet. By the time it’s done, the numbers have already moved.
With Pipeline Connect: The pipeline and marketing numbers land in one dashboard that refreshes on a schedule. The board slide becomes a link that’s always current, and the monthly rebuild disappears.
Verdict: If your monthly report is a manual rebuild, Pipeline Connect can build it once as part of your plan, from $99/month. It’s rolling out now, so talk to us to scope yours.
Scenario 2: Agency reporting CRM and web results to clients
The situation: An agency reports on both pipeline and web performance for its clients. Each client report means logging into two tools, exporting, and formatting a deck by hand, which eats billable hours every reporting cycle.
With Pipeline Connect: Each client gets a shareable dashboard that combines their Pipeline CRM pipeline with their web analytics, refreshed on a schedule. The agency shares a link instead of building a deck.
Verdict: If client reporting is eating billable time, Pipeline Connect can stand up a managed dashboard per client. Early access is open, so talk to us about your setup.
Scenario 3: Founder who wants pipeline and marketing on one screen
The situation: A founder wants to see pipeline health and where leads are coming from without asking two people for two reports. Today the answer lives across the CRM, an analytics tab, and a spreadsheet nobody keeps current.
With Pipeline Connect: One dashboard shows pipeline value, win rate, and lead sources side by side, refreshed on a schedule, open any time on any device.
Verdict: If your numbers live in three places, Pipeline Connect can bring them into one managed view, from $99/month as part of your plan. Talk to us to get early access.
Your pipeline and your web analytics in one view that keeps itself current. No CSV exports, no rebuilding charts.
Part of Pipeline Connect. Flat monthly fee.
The reporting dashboard is part of Pipeline Connect, our managed integration add-on for Pipeline CRM, from $99/month. We build and maintain it so you don’t have to. We’re rolling out the productized dashboard now, so talk to us to scope yours and get early access. Additional data sources, bespoke metrics, or a custom layout are scoped as a custom add-on.
Pipeline Connect
Up to 5 integrations included. Your dashboard counts as one.
- Up to 5 integrations (any type)
- Custom integrations included
- $0 setup fee
- Monitored and maintained for you
- US-based live chat support
- Cancel anytime, no contracts
Pipeline Connect Pro
Up to 15 integrations. Priority handling for larger stacks.
- Up to 15 integrations (any type)
- Custom integrations included
- $0 setup fee
- Monitored and maintained for you
- US-based live chat support
- Cancel anytime, no contracts
Pipeline CRM subscription required (starts at $25/user/month, billed annually). Pipeline Connect does not include the cost of any third-party analytics tools you connect; you bring your own source accounts. Prices in USD.
Want the full Pipeline Connect overview? See pricing details, the complete list of available integrations, and the integration FAQ on the Pipeline Connect page →
Frequently asked questions
Can’t find what you need? Contact our team.
Is the reporting dashboard available now?
We’re rolling out the productized dashboard now. The connection that pulls your Pipeline CRM data into the data store behind it is already live; the packaged CRM plus web-analytics dashboard is in development. Talk to us to scope your dashboard and get early access, and we’ll confirm the timeline when we scope yours.
How is this different from Pipeline CRM’s built-in reports?
Pipeline CRM has built-in reports and dashboards for your CRM data, and for most CRM-only reporting those are the right tool. This dashboard is for when you want your CRM data combined with outside sources, like web analytics, in one shared view you don’t have to build or maintain. It’s a managed service that brings multiple sources together, not a replacement for in-app reporting.
What’s in the starter dashboard?
The starter dashboard combines your Pipeline CRM pipeline metrics (deals, pipeline value by stage, win rate, and activity) with one web-analytics source (sessions, leads, and traffic by channel) in a single view. Additional sources like ad platforms or other spreadsheets, and bespoke metrics or a custom layout, are scoped as a custom add-on.
Do I need a BI tool or a paid license?
No. We build and maintain the dashboard for you, so there’s no separate BI platform for you to buy and no license to manage. You get a single dashboard you can share with anyone on your team.
Does the dashboard update in real time?
No. The dashboard refreshes on a schedule rather than in real time, which is the right fit for reporting. You always open a current view without exporting anything or rebuilding a chart.
How is this different from the Google Sheets Data Sync integration?
The Google Sheets Data Sync moves your Pipeline CRM data into a spreadsheet on a schedule. The reporting dashboard is the reporting view built on top of that data: it combines your CRM metrics with web analytics into one shared dashboard you can hand to your team. The sync is the pipe; the dashboard is the view.
What does it cost?
The reporting dashboard is part of Pipeline Connect, which starts at $99/month for up to 5 integrations and $249/month for up to 15, with $0 setup fees and no contracts. Your dashboard counts as one integration in your plan. Additional data sources or a bespoke layout are scoped as a custom add-on.