
Pipeline reporting and sales forecasting
See what the pipeline is actually doing. Build a report from a saved view, drill into it with your own custom fields, and have the version your Monday meeting needs arrive by email before the meeting starts.
✓ No credit card required ✓ 14-day free trial ✓ Cancel anytime
Trusted by over 18,000 users globally





At a Glance
Pipeline CRM reports on deals, activity and goals from inside the CRM. Reports build from saved list views, so the filters you already use become the report, and Breakdown Group By drills into your own custom fields. Data refreshes in seconds. Deal, activity and goal reporting are on every plan; scheduled recurring delivery is on Grow and above.
Most pipeline reporting happens in a spreadsheet
Not because the CRM cannot report, but because getting the specific cut someone asked for is harder than exporting and rebuilding it by hand.
The manager rebuilds the same report every week
Export, pivot, format, send. It takes hours that repeat every Monday, and the numbers are already stale by the time anyone reads them.
The report cannot see your own fields
If reporting only groups by the fields the vendor shipped, the dimension your business actually runs on is the one you cannot group by.
Forecasts are opinion, not history
Without a view of won and lost deals over time, quota confidence comes down to what each rep says about their own deals.
The filters you already use become the report
Reporting is built on list views rather than a separate query tool, so there is no second filtering language to learn.
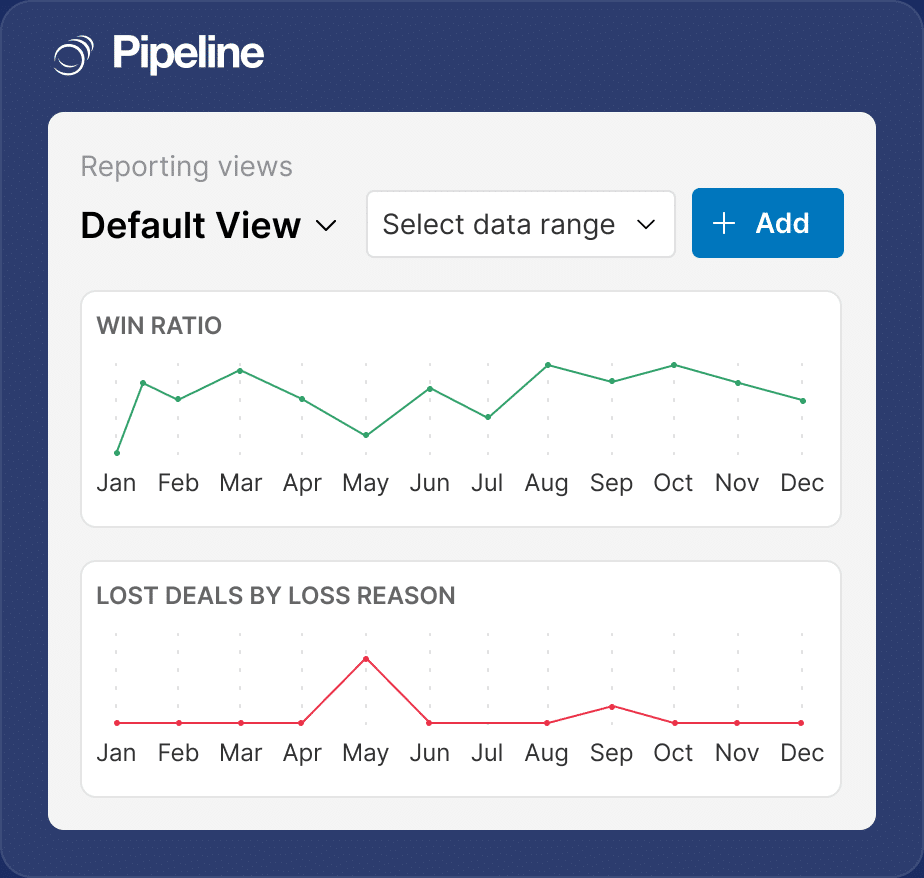
Start from a saved view
Import the filters from a list view you already use to update or build a report, instead of recreating the same conditions in a different screen.
Drill down with your own fields
Breakdown Group By works on select custom fields, including picklist, checkbox, boolean and association fields, so you can group by the dimensions your business actually uses.
Compare, then schedule it
Adjust the date range to compare periods side by side, then have the view delivered by email on a schedule. Scheduled delivery is on the Grow plan and above.
Anyone who has to answer for the number
Reporting matters most where someone outside the deal has to understand it without asking the rep.
Sales managers running a weekly review
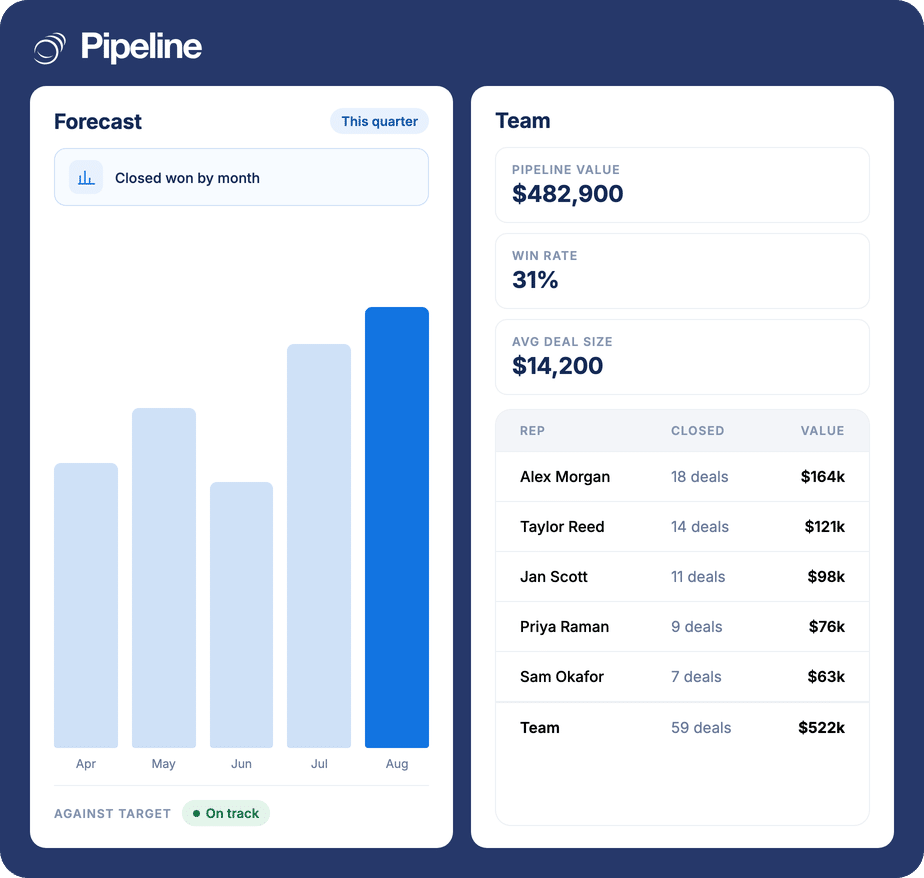
Deals by Owners and activity reporting turn the pipeline review into reading a report rather than assembling one.
Owners forecasting against quota
Historical won and lost data is what makes a quota forecast a projection rather than a hope.
Teams with an unusual data model
If you track something the vendor never anticipated, grouping reports by that custom field is the whole point.
What reporting covers
Where a capability depends on your plan it says so; the pricing page carries the full matrix.
Deal and activity reporting
Report on deals and on what reps actually did. On every plan.
Goal reporting and dashboards
Team and individual goal dashboards, on every plan.
Views
Saved report views you return to rather than rebuild.
Build from a saved list view
Import filters from a list view to update or start a report.
Breakdown Group By
Group by select custom fields: picklist, checkbox, boolean and association fields.
Date-range comparison
Adjust the range to compare numbers across periods.
Pipeline history
Won and lost deals, active pipeline and deal stage status over time.
Deals by Owners
See the pipeline split by rep without building it by hand.
Real-time data
Reports reflect changes in seconds rather than hours.
Calls report
Reports > Calls shows call volume, talk time and outcomes for accounts using Pipeline Phone, a paid add-on.
Scheduled delivery
Send a View by email on a recurring schedule. Grow plan and above.
Exports
5 exports per user per month on Start; unlimited on Develop, Grow and Enterprise.
A report nobody rebuilds is a report people read
The test of CRM reporting is not how many chart types it offers. It is whether the person who needs Monday’s number can get it on Monday without exporting anything. Once the report builds from a view you already trust and arrives on its own, the spreadsheet step quietly disappears.
Reporting and forecasting questions
Can’t find what you need? Contact our team.
How do I know if a CRM’s reporting is strong enough for pipeline forecasting?
Three questions separate reporting that works from reporting that looks good in a demo. Can it group by your own custom fields, or only the vendor’s? Can a report be built from filters you already use, or does it need rebuilding in a separate tool? And can it be delivered on a schedule without someone exporting it?
Pipeline CRM answers those with Breakdown Group By on select custom fields, reports built from saved list views, and scheduled View delivery on the Grow plan and above.
Can I build reports without exporting to a spreadsheet?
Yes, and that is the main thing this replaces. A report starts from a saved list view, so the filters you already use become the report definition rather than something you rebuild.
Date ranges are adjustable for period-on-period comparison, and data refreshes in seconds, so the number you are looking at is current rather than as of the last export.
Can reports group by my own custom fields?
Yes. Breakdown Group By works with select custom fields, including picklist, checkbox, boolean, single association and multiple association fields.
That matters when the dimension your business runs on is one you created yourself, which is usually the dimension a stock report cannot see.
Which plans include reporting?
Deal and activity reporting, goal reporting and the team and individual goal dashboards are available on every plan, including Start.
Two things scale with plan: exports are limited to 5 per user per month on Start and unlimited above it, and scheduled recurring delivery of a View is on the Grow plan and above. The pricing page has the full matrix.
Can a report be emailed to me automatically?
Yes, on the Grow plan and above. You can schedule a View for recurring delivery by email, which is how the report for a standing Monday meeting arrives before the meeting rather than during it.
On Start and Develop, Views are still saved and reusable; they just need to be opened rather than delivered.
How does the CRM help with sales forecasting?
By making the history legible. You can see won and lost deals, active pipeline and deal stage status over time, which is what turns a forecast into a projection from past trends rather than a collection of rep opinions.
Goal reporting and the team and individual dashboards then show who is tracking against quota, so coaching conversations start from the same numbers everyone else is seeing.
How current is the data in a report?
Reports work from real-time data and reflect changes within seconds rather than on an overnight refresh.
In practice that means you can change a deal and check its effect on the report in the same sitting, instead of finding out the next morning.