In the fast-paced world of sales, gut feelings and intuition aren’t enough to drive success. The sales cycle is a critical component of any business’s sales process, and measuring its effectiveness often involves several key ratios and metrics.
This is where sales key performance indicators (KPIs) play a vital part. They are what thriving sales teams use to keep a pulse on the efficacy of their sales process. Sales KPIs do more than just track numbers; they provide invaluable insights into your sales process, team performance, and overall business health.
Here are some of the most commonly used ratios and metrics to measure sales cycles.
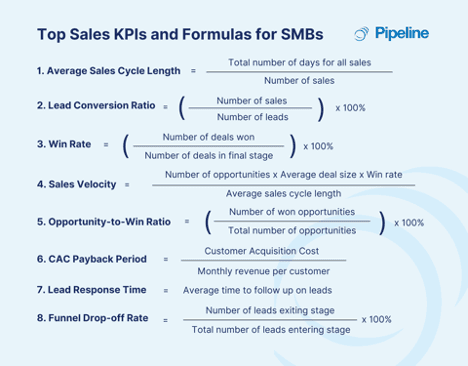
1. Average Sales Cycle Length
This is the average amount of time it takes for a lead to progress through the entire sales process and become a customer. It’s calculated by summing the lengths of all sales cycles within a period and dividing by the number of sales.

2. Lead Conversion Ratio
This ratio measures the percentage of leads that convert into actual sales. It is calculated by dividing the number of sales by the number of leads and multiplying by 100 to get a percentage.

3. Win Rate
The win rate is the ratio of the number of deals won to the number of deals in the final stage of the sales pipeline. This ratio helps businesses understand how effective their sales team is at closing deals.

4. Sales Velocity
Sales velocity measures how quickly leads move through the sales pipeline and generate revenue. It is calculated by multiplying the number of opportunities by the average deal size and the win rate, then dividing by the average sales cycle length.

5. Opportunity-to-Win Ratio
This measures the efficiency of the sales process by calculating the ratio of the number of won opportunities to the total number of opportunities created.

6. Customer Acquisition Cost (CAC) Payback Period
This metric calculates the time it takes for a customer to generate enough revenue to cover the cost of acquiring them. It’s an important metric for understanding the efficiency and sustainability of the sales process.

7. Lead Response Time
This is the average time it takes for the sales team to follow up on leads. A quicker response time can lead to a shorter sales cycle and higher conversion rates.

8. Funnel Drop-off Rate
This ratio measures the percentage of leads that exit the sales funnel at each stage without converting. It helps identify areas for improvement in the sales process.

Track Your Sales KPIs with Pipeline CRM’s Reporting Feature
Tracking and measuring sales KPIs are critical for any business looking to boost revenue, streamline operations, and stay ahead of the competition. These sales metrics can provide valuable insights into the effectiveness of a company’s sales strategy and areas where the sales process may be optimized for better performance.
So, what does your data say? Use Pipeline CRM’s robust Reports and Views to track your sales metrics to make better decisions or optimize your process. In the latest update from our Reports and Views features, you can see and update all your reports at once! Get the most up-to-date information at your fingertips with access to real-time data in Pipeline CRM Reports. See the video below to see it in action.
See Unlimited Reports in a Single View
Not a Pipeline CRM customer? Get a free 14-day trial to see for yourself!
Check out other sales KPIs and measurement guides:


