Every industry faces unique sales challenges. Relying solely on generic sales KPIs, such as conversion rate and customer lifetime value (CLV), might obscure critical insights that can drive your business forward.
This article dives into 12 industry-specific sales KPIs for construction, logistics and transportation, professional services, and real estate. Plus, we’ll show you how to easily track and generate sales reports using Pipeline CRM software, helping you to streamline sales data collection and analyze its performance.
Sales Metrics for the Construction Industry

This includes tracking the sales performance of construction companies as well as painting, plumbing, and landscape contractors.
1. Cost Variance (CV)
Cost variance (CV) refers to the difference between the projected cost and the actual cost incurred in a construction project. Knowing this sales metric lets you identify potential cost overruns and closely track the overall project cost. Here’s how to calculate cost variance:
Cost Variance = Estimated Cost – Actual Cost
- Estimated cost: the budgeted cost based on the project’s initial planning.
- Actual cost: the real cost incurred for the project to complete.
- A positive cost variance indicates that the project is under budget, while a negative cost variance means it’s over budget.
Related: Learn about 10 key sales metrics every sales representative should track.
2. Account Receivable Turnover and Accounts Payable Turnover
Accounts receivable turnover (ART) measures how often a construction company collects payments from clients, while accounts payable turnover (APT) indicates how efficiently it pays its suppliers. Understanding both ART and APT is crucial for effective cash flow management. By optimizing these metrics, construction businesses can improve financial health, strengthen supplier relationships, and create a more stable financial foundation.
Here’s how to calculate account receivable turnover:
Account Receivable Turnover (ART) = Net Credit Sales / [(Beginning AR Balance + Ending AR Balance) / 2]
- Beginning account receivable (AR) balance: the money clients owe at the start of a specific accounting period.
- Ending account receivable (AR) balance: the money clients owe at the end of a specific accounting period.
- A high account receivable turnover (ART) indicates faster collections and strong cash flow.
For example:
- A construction company generates $1,000,000 in credit sales during a year.
- The beginning AR balance is $100,000, and the ending AR balance is $150,000.
- Account receivable turnover = $1,000,000 / [($100,000 + $150,000) / 2] = $1,000,000 / $125,000 = 8 times. This means the construction company collected its payment from the client 8 times during the year.
Here’s how to calculate account payable turnover:
Account Payable Turnover (APT) = Total Purchases / [(Beginning AP Balance + Ending AP Balance) / 2]
- Total purchases: the total money spent on a project.
- Beginning account receivable (AR) balance: the money owed to suppliers at the start of a specific accounting period.
- Ending account receivable (AR) balance: the money owed to suppliers at the end of a specific accounting period.
- A high APT indicates an ability to pay bills quickly, and a low APT indicates potential financial problems.
For example:
- A construction company makes $1,000,000 in purchases on credit during a year.
- The beginning AP balance is $100,000, and the ending AP balance is $80,000.
- Account payable turnover = $1,000,000 / [($100,000 + $80,000) / 2] = $1,000,000 / $90,000 = 11.11 times. This means the construction company paid its suppliers 11.12 times during the year.
3. Working Capital Ratio
Construction businesses often face short-term expenses like material purchases and payroll. To assess their ability to cover these costs, calculating the working capital ratio is crucial. Here’s how to calculate it:
Working Capital Ratio = Current Assets / Current Liabilities
- Current assets: including cash, accounts receivable, and other inventory that can be converted into cash (usually within a year).
- Current liabilities: including accounts payable, loans, accrued expenses, and other debts (usually within a year).
- An ideal working capital ratio is 1.5 or higher. A ratio below 1 indicates potential liquidity problems.
- For example, if the result is 1.57, your construction business has $1.57 in current assets for every $1 of current liabilities.
Related: Confused by sales jargon? Our A-Z glossary of sales terminology provides clear definitions for common sales terms.
Sales KPIs for the Logistics and Transportation Companies

4. Lanes Won
In the logistics and transportation industries, “lanes” refer to the shipment routes between two locations. This means that “lanes won” refers to the routes a company has successfully secured to transport goods for a defined period.
Lanes Won = Total Number of Unique Lanes Secured
To get a more in-depth understanding of the metric, you can break the calculation further based on the following:
- Transportation mode: truckload, air, or sea, etc.
- Industry segmentation: food and beverage, ecommerce, or manufacturing industry.
- Density: the number of shipments per lane to examine the profitability and utilization.
For example, your logistics business secures the following number of lanes in a month:
- 30 truckload lanes
- 10 air freight lanes
- 15 sea freight lanes
- Total lanes won = 30 + 10 + 15 = 55 lanes
5. Revenue Per Load
Revenue per load measures the average income generated from each logistics shipment. It helps assess the efficiency of operations and the effectiveness of pricing strategies in relation to overall profitability. Here’s how to calculate revenue per load:
Revenue Per Load (RPL) = Total Revenue / Total Number of Loads
- Total revenue: all the generated revenue from shipments within a certain period.
- Total number of loads: the total number of shipments completed within a certain period.
It’s difficult to set the benchmark as the ideal revenue per load differs depending on the mode of transportation, distance, weight, location, and other factors.
That said, here’s an example of its calculation:
- Total revenue: $1,200,000
- Total number of loads: 400 loads
- Revenue per load = $1,200,000 / 400 loads = $3,000 per load
6. Sales Activity Index
Measuring the sales activity index allows you to assess the relationship between your logistics sales effort and sales results. In other words, how effective your sales reps are in generating paying customers.
There’s no standardized formula to calculate the sales activity index, as it is based on the specific sales metrics and activities you want to track. However, the common approach is as follows:
Sales Activity Index = Number of Sales / Number of Sales Activities
- Number of sales: including the generated revenue, number of signed contracts, or new clients acquired.
- Number of sales activities: including sales outreach (emails, calls, and texts) and the number of proposals sent.
It’s important to note that not all leads or sales activities contribute equally to revenue. To accurately measure sales efficiency, consider assigning different weights to different types of sales. For example, securing large contracts or acquiring new clients should be valued more highly than smaller contracts or recurring revenue.
Sales Metrics for Professional Services

This includes tracking the sales performance of agencies or consulting firms (operations, HR, management, strategy, IT, marketing, etc).
7. Sales Pipeline Value and Coverage
Sales pipeline value refers to the total expected revenue from all the active leads and opportunities in the pipeline. On the other hand, sales pipeline coverage is the ratio of the total pipeline value to the sales target or quota. Knowing your income potential helps you predict future revenue and manage resource allocation, such as marketing expenses and task prioritization.
Here’s how to calculate the sales pipeline coverage:
Sales Pipeline Coverage = Total Pipeline Value / Revenue Target
- Total pipeline value: the sum of the estimated value of all the active leads in the pipeline.
- Revenue target: the desired sales revenue for a specific period.
The ideal pipeline coverage is generally between 3 and 5. However, a high pipeline coverage doesn’t necessarily guarantee sales; the quality of opportunities also matters. This guide will show you how to measure lead quality.
For example:
- Total pipeline value: $500,000
- Revenue target (quarterly): $200,000
- Sales pipeline coverage = $500,000 / $200,000 = 2.5.
- This indicates that the agency has 2.5 times the required revenue in its pipeline in this specific quarter.
8. Billable Hours
Billable hours refer to the time spent working on client projects that can be charged or billed within a specific period (usually on a weekly or monthly basis). Here’s how to calculate billable hours:
Total Billable Hours = Total of Hours x Hourly Rate
Keep in mind that not all project-related activities are billable. To understand which actions are billable, here are some examples of billable hours for an advertising agency:
- Creative development: project brainstorming, designing, and copywriting.
- Account management: client meetings, project reporting, and performance analysis.
- Social media and SEO management: content creation, email marketing, SEO optimization.
Here are some examples of non-billable hours:
- Training and skill development, e.g., watching online courses.
- Attending networking events.
- Internal team meetings that don’t involve client work, e.g., dividing the workload.
9. Forecasted Revenue Recognition
Forecasting revenue recognition involves a prediction of when a company will earn income based on sales pipeline and project timelines. This is crucial for agencies to plan finances, allocate resources, and manage cash flow. The timing of revenue recognition is directly linked to how clients are charged, whether it’s by project completion, retainers, subscriptions, or performance.
Here’s an example of how to calculate the forecasted revenue for an advertising agency:
- Project: social media campaign
- Contract value: $100,000
- Duration: 3 months
- Revenue recognition method: percentage of completion
- Phase 1 is 30%, phase 2 is 40%, phase 3 is 20%, and phase 4 is 10%.
Forecasted Revenue Recognition:
- Month 1: $25,000 (Phase 1 completion)
- Month 2: $40,000 (Phase 2 completion)
- Month 3: $35,000 (Phases 3 and 4 completion)
Please note that this is a simplified example. When calculating the forecasted revenue recognition, you should consider dynamic factors such as project scope, delays, or early termination, which can impact the revenue recognition results.
Sales Metrics for the Real Estate Industry

This includes tracking the sales performance of real estate agents, property managers, or property developers.
10. Sales Volume
Sales volume refers to the total value of properties sold within a definite period. This sales metric helps to assess the real estate firm’s market position, agent productivity, and overall business health. Here’s how to calculate sales volume in the real estate industry:
Sales Volume = Property 1 Price + Property 2 Price + … + Property N Price
If you own a large real estate company with multiple agents or offices, you can calculate sales volume per agent, per office, or by property type to get more detailed insights.
11. Listing-to-Meeting Ratio
The listing-to-meeting ratio measures how effectively a real estate agent converts initial meetings with potential clients into actual property listings. Here’s how to calculate the listing-to-meeting ratio:
Listing to Meeting Ration = (Number of Listing Secured / Number of Meetings Held) x 100%
- Number of listings secured: the number of properties an agent or firm has successfully listed for sale.
- Number of meetings held: the number of initial meetings or consultations held with potential sellers.
For example:
- An agent held 16 meetings with potential sellers in a month and secured 8 listings.
- Listing to meeting ratio = (16 / 8) x 100% = 20%
This means that the agent was able to convert 20% of their meetings with potential sellers into actual listings.
12. Commission Rate Per Sale
The commission rate per sale refers to the percentage of the property’s sale price given to the real estate agent as payment for their services. Here’s how to calculate the commission rate per sale:
Commission Rate = (Total Commission Earned / Sale Price of the Property) x 100%
Real estate commission rates can vary significantly based on location, market conditions, and the specific agreement between the agent and client. While the traditional commission rate often ranges from 5% to 6% of the sale price, there are alternative structures:
- Commission split: this is one of the most common arrangements, where the commission is typically divided equally (50/50) between the buyer’s and seller’s agents.
- Negotiated rates: agents and clients may agree on a custom commission rate based on the property’s value, market conditions, or the services provided.
- Flat fees: instead of a percentage, agents may charge a fixed fee, which can be converted into an equivalent commission rate for comparison purposes.
For example:
- The sale price is $500,000, and the total commission earned is $30,000 this quarter.
- Commission rate = ($30,000 / $500,000) x 100% = 6%.
- This means this real estate agent earned a 6% commission for this quarter.
How Pipeline CRM Reporting Keeps Your Sales KPIs Right On Track
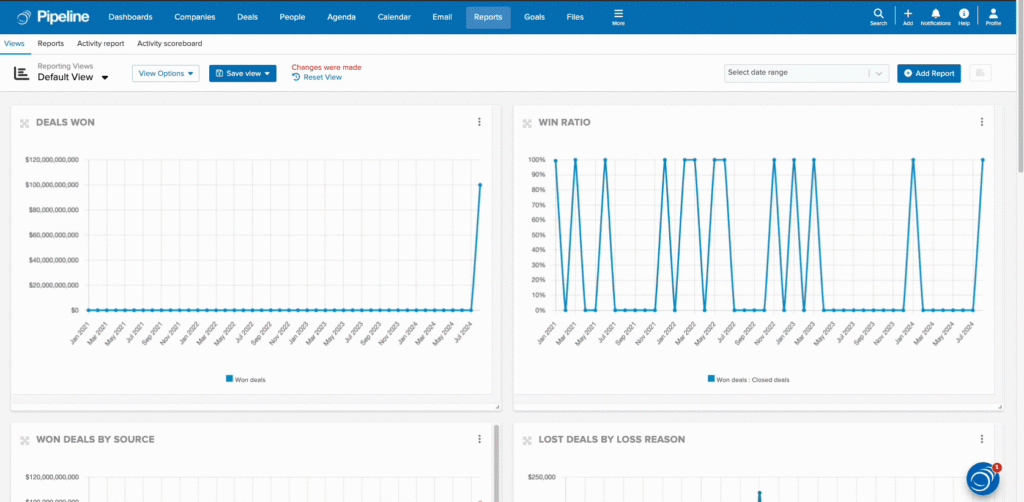
One of the key benefits of using sales CRM software is the ability to easily generate reports that closely monitor your sales growth and team performance. However, most CRM systems are limited in that they can only display a few sales metrics in a single view. If you want to check additional metrics, you often have to replace the previous reports.
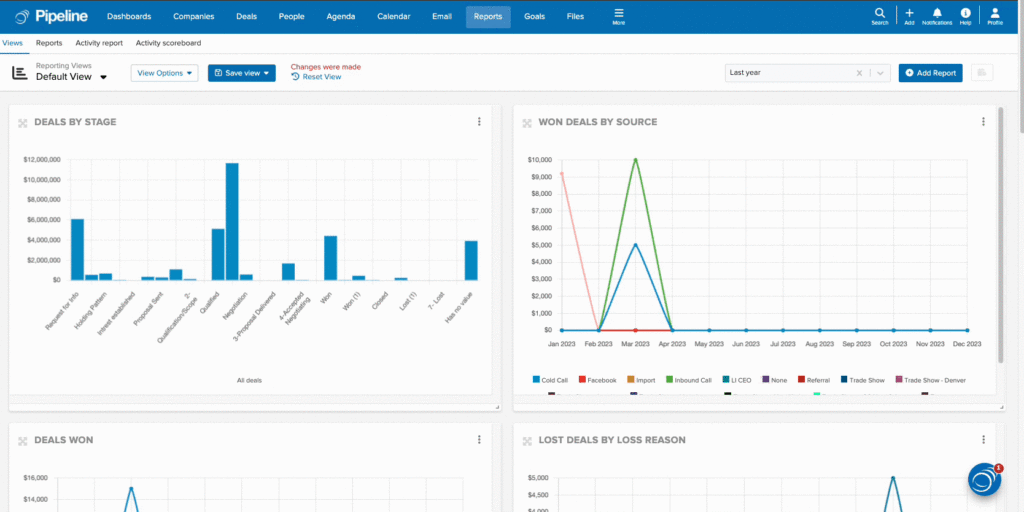
With Pipeline CRM’s new and improved reporting capabilities, you can view multiple reports in a single window. You can also adjust the size of each view (e.g., from half to full-width screen) and drag and drop the most important metrics to the top of the list.

To analyze sales performance over time, simply select a predefined time range or create a custom one. All reports in the list view will automatically adjust to the chosen timeframe. Additionally, the displayed data is dynamic, so deals no longer meeting the specified criteria will be excluded from relevant reports. For example, a deal with a status of ‘won’ will no longer appear in the ‘deals on progress’ report.

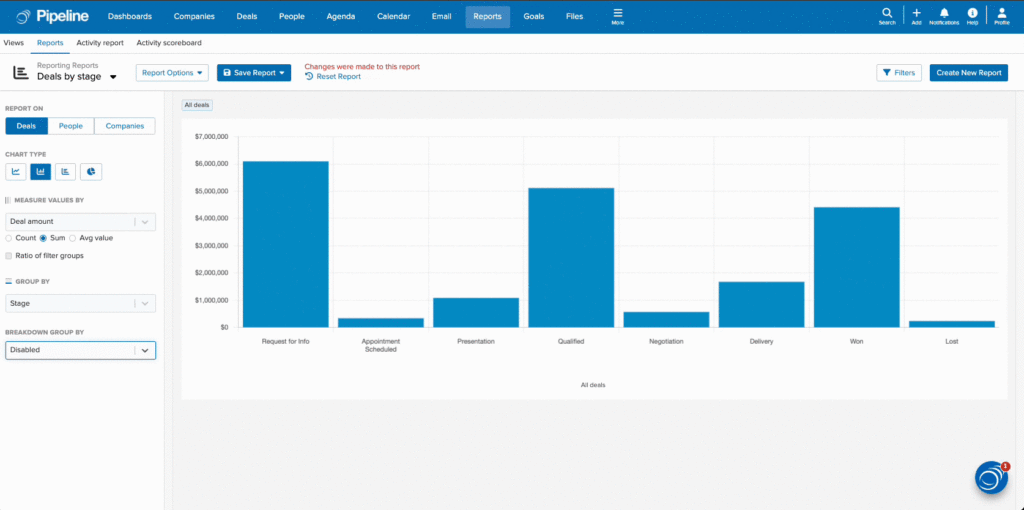
Furthermore, to analyze the sales report more deeply, simply apply the relevant filters. For instance, you can change the value measurement method from ‘sum’ to ‘average’ and display the data based on ‘project type,’ ‘owner,’ or ‘deal status.’

Other handy sales reporting features of Pipeline CRM include:
- Various default report views, such as deals won, deals by stage, and activity report.
- Create, save, and share new report views with your team.
- Download the reports as PNGs or PDFs and schedule them to be automatically sent to your inbox based on the chosen time (e.g., every Friday morning).
Streamline Your Sales KPIs Reporting Process with Pipeline CRM
By incorporating these industry-specific sales metrics into your tracking strategy, you’ll gain a deeper understanding of your business’s performance and identify areas for improvement. This empowers you to optimize your sales strategies and drive sustainable growth.
To simplify sales data collection and analysis, consider adopting Pipeline CRM. Our CRM software lets you easily gather and track all relevant sales metrics, delve into detailed results, and share insights with your sales team.
Sign up for Pipeline CRM today and experience the power of our robust sales reporting solution.


