CRM reporting is one of the most valuable yet underused features in many sales teams’ CRM software. These sales reports go beyond showing whether sales goals are being met. They track and highlight areas that need improvement, reveal opportunities for growth, and even forecast how your sales pipeline may develop in the coming months.
We’ll walk you through creating a CRM report to analyze sales performance using Pipeline CRM’s customizable reporting and forecasting features, explore additional sales reporting tools that can enhance your results, and share key metrics to help you get started.
What is a CRM Report?
CRM report refers to the analytic tool, built within a CRM, that allows you to pull and analyze sales, leads, and team performance data based on specific metrics.
The goal for creating a CRM report is to get both high-level and granular performance data in an easy-to-understand format, such as a table, chart, and diagram.
Some CRMs allow you to save the sales KPIs and visualization format as templates and share them with the team. This way, you can always refer to the same sales metrics and have reliable, accurate data to present to the board or even leads.
Essential Sales Metrics and KPIs for Effective Sales CRM Reporting
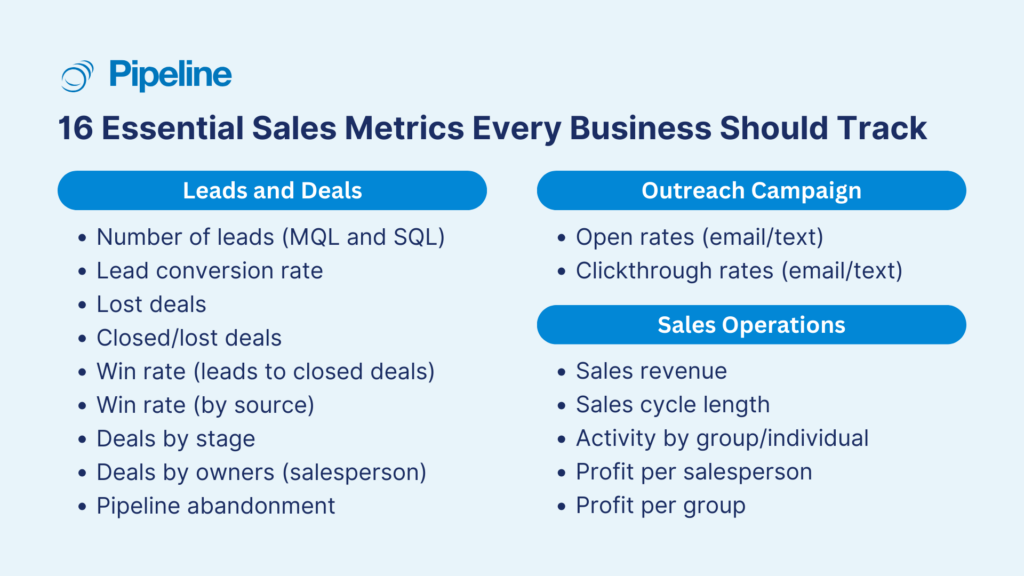
Some important sales metrics to track and analyze on a CRM sales report include:
Leads and Deals | Outreach Campaign | Sales Operations |
Number of leads (MQL and SQL) | Open rates (email and text) | Sales revenue |
Lead conversion rate | Click-through rate | Sales cycle length |
Win and loss rate | Profit per salesperson | |
Deals by stage and owners | Activity (group and individual) |
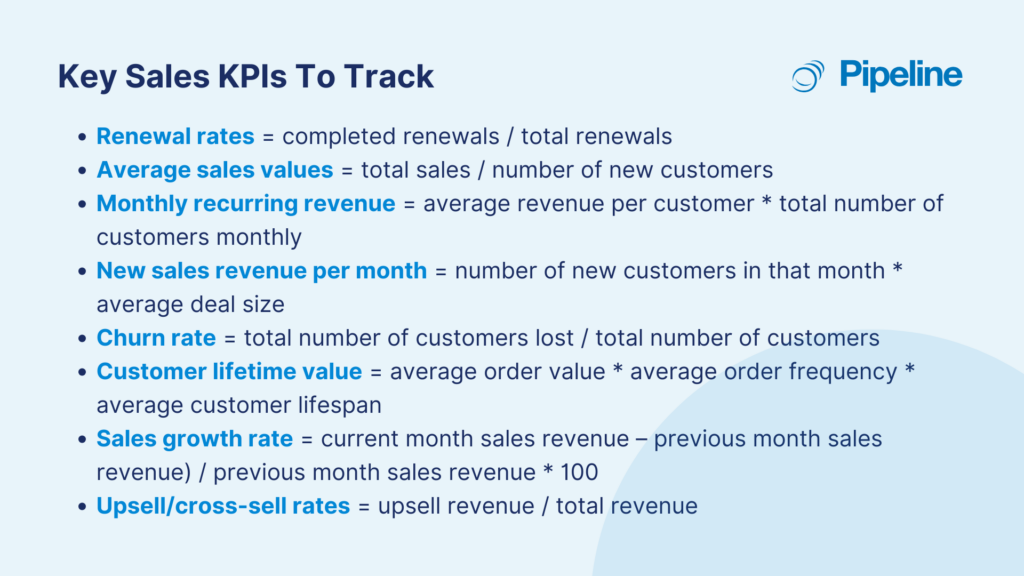
And here are some sales KPIs recommended to include in sales CRM reports
- Renewal rates = completed renewals / total renewals
- Average sales values = total sales / number of new customers
- Monthly recurring revenue (MRR) = average revenue per customer x total number of customers monthly
- Churn rate = total number of customers lost / total number of sustomers
- Customer lifetime value (CLV) = average order value x average order frequency x average customer lifespan
These sales metrics and KPIs are a helpful starting point. You should be able to create custom reports specific to your company or industry.
Related: Not all sales metrics apply to your industry. Find out the top 12 sales metrics and KPIs you should track for construction, professional services, and real estate companies.
How to Use Pipeline CRM’s Sales Reporting Feature to Generate CRM Reports
To show you how to create a CRM report, we’ll use the Pipeline CRM sales tracking and reporting solution. Its customization feature allows you to get a granular and high-level analysis of your team’s activity and deals, and even forecast your sales health.
You have two options to start creating the sales CRM report—both require no complex Excel formulas or separate spreadsheets.
- Start with a default set of reports you can use to extract insights, or
- Create ad hoc and custom reports to get answers to specific questions.
Let’s see the capabilities of Pipeline CRM’s data reporting solution.
Step 1: Creating Your First CRM Report
Let’s start by generating a report using the default templates and metrics. Go to your Dashboard > Reports (on the menu tab) > Reports (on the sub-menu tab) > Create New Report.

One left side, you see the sales report customization options. You can select the data source (Deals, People, or Companies), chart types, value measurement (count, sum, average value), and flexibility to group the data, and time period.
Step 2: Filter the Data to Only Show Information That Matters
If you’ve created custom Views on your Companies/Deals/People data, you can export them here. To do so, click on the Filters button (right top) > click on Import Filters > select the View you want to see. If you want to create a new CRM reporting filters, simply click on Add Filter Group.

Once the data is pulled through, customize the reports. For instance, change the graph type into line graph, only show data from 30 days ago, and break the data by Owner.

Step 3: Save and Share the CRM Reports
Once you’re happy with the report format and data shown, save this settings and share them with your teams. This way, you can save time everytime you need to check on your sales performance and ensure that all stakeholders are seeing the same data to avoid miscommunication.
Click on the Save Report button > Save As New Report > Give a name to your report > click Save.

Add back the report you just created to your View tab. This allows you to consolidate all your reports into one single page, helping in comparing and analyzing the saved dataset with other metrics or information.
You can also reorder the reports (e.g., key data on the top view) and change the window size (e.g., bigger views fro key reports).
See Pipeline CRM sales reporting feature in action in this demo video.
Pipeline CRM Reporting and Forecasting Customization Options
Note: Pipeline CRM has recently updated our interface. This guide is still referring to the old look, but the features and capabilities reman the same, even better!
CRM Reporting and Forecasting with Pipeline CRM: The Basics
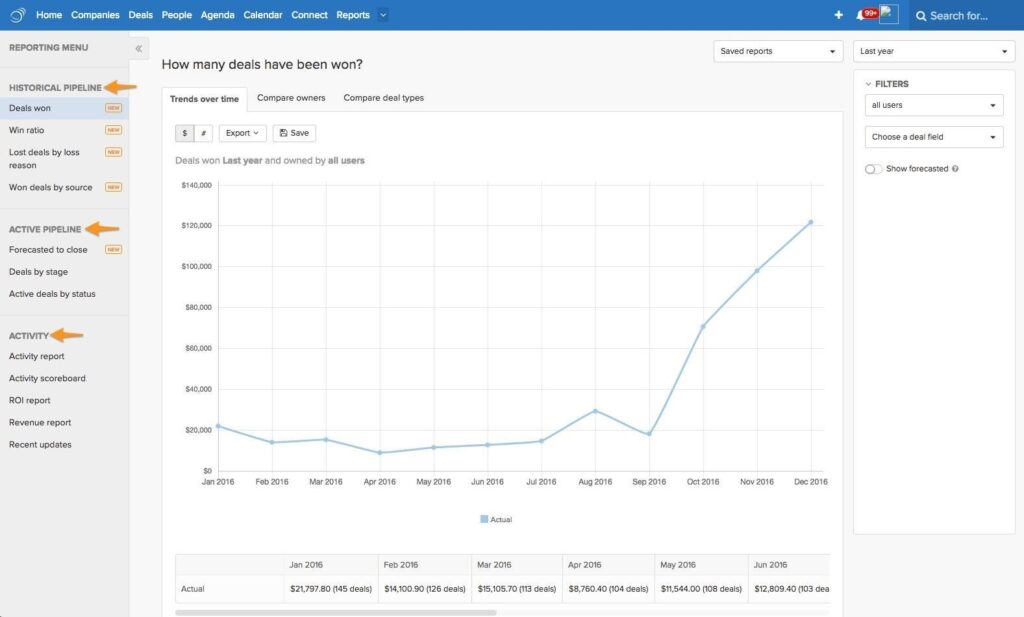
You can navigate between reports using the left-side navigation. Reports are divided into three sections:
- Historical Pipeline: includes deals won, win ratio, lost deals by loss reason, and won deals by source.
- Active Pipeline (Sales Forecasting): includes forecasted to close, deals by stage, and active deals by status.
- Activity: includes your activity report, activity scoreboard, revenue report, recent updates, and potentially your ROI report.
Sales Trends and Comparison Analysis with Pipeline CRM
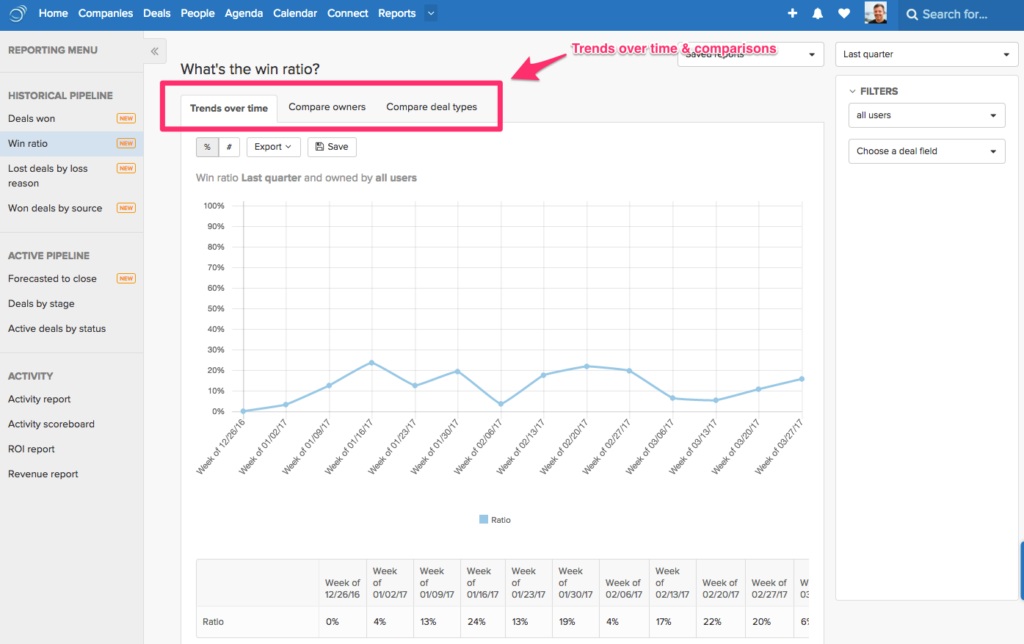
Each report has three sub-sections to help you compare trends over time, deal owners, or custom deal types.
- Trends Over Time: report on deals over a given timeframe. It allows you to view trends over time.
- Compare Owners: enables you to report and draw comparisons between individual salespeople or teams of salespeople.
- Compare Deal Types: enables you to compare specific types of deals by filtering custom fields that you track in Pipeline.
Setting Sales CRM Reports for Specific Time Periods
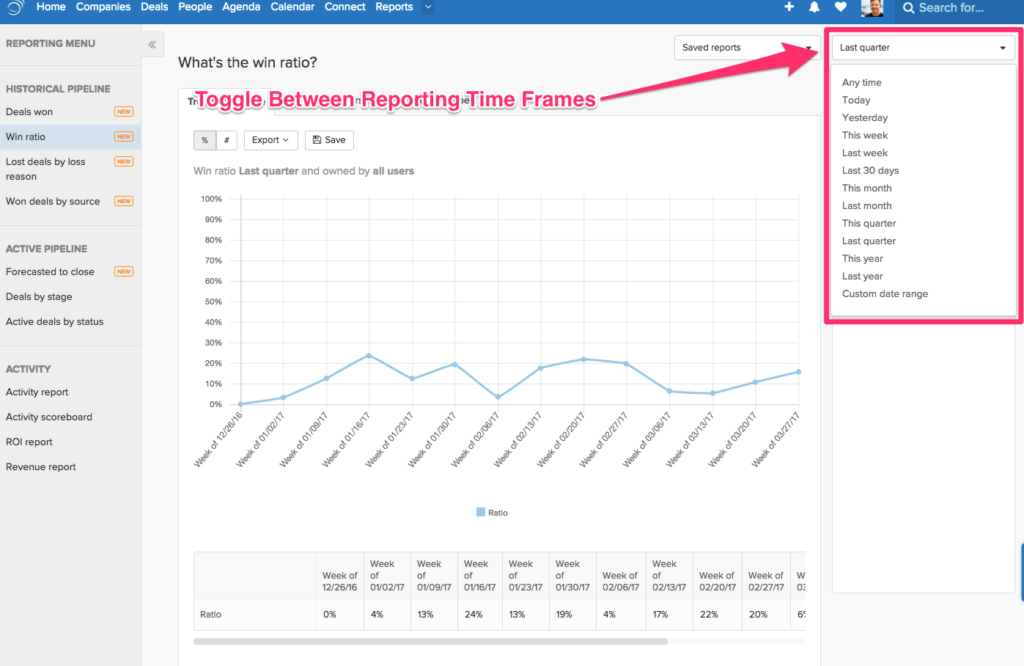
You can create reports or sales forecasts for various timeframes using the date selector in the upper-right corner of the screen on the Reports tab. The following options are available:
- Any time
- Today, yesterday, and this week
- This month and last month
- This quarter and last quarter (calendar)
- This year and last year (calendar)
- Custom Range
Sales Reports Analysis Based on Specific Owners or Types of Deals
You can drill-down on a specific sales rep’s deals (or types of deals) using the filter sidebar of the right side of your screen.
In the Trends over time subsection, you can filter by owner, source, and/or dropdown and picklist custom deal fields. The Compare owners subsection allows you to filter by source and/or dropdown and picklist custom deal fields. And, you can filter by the owner within the Compare deal fields subsection.
For the reports ‘Lost deals by loss reason’ and ‘Won deals by source,’ you can also specify what sources or lost reasons you are viewing.
Take a look at the links below to get a breakdown of each report:
- Lost deals by lost reason
- Won deals by source
- Deals Won
- Forecasted to close
- Win ratio
- How to build a report that tells you which deals need attention
Learn more about Pipeline CRM sales reporting feature from our knowledge base.
Other Sales Reporting and Analytics Tools Worth Trying
The information gained from the CRM reports should be sufficient to analyze your business performance and the sales team activities. That said, if you don’t have a CRM to create a sales performance report or need a more advanced reporting tool, the following solutions may be your favorite sales monitoring software.
Microsoft Excel: Best for Enterprises With Frankenstein Sales Tools
Does your team have a Frankenstein Stack? “A Frankenstein stack is characterized by multiple legacy systems stitched together over time, with add-ons, individual integrations, and tech workarounds.”
Many companies face a fragmented data landscape, with sales relying on a CRM and marketing using a legacy system integrated with web and sales analytics. This divide often necessitates data exports in XML or CSV formats for cross-departmental collaboration.
While this approach may be necessary for the time being, it introduces challenges like version control and data entry consistency. Excel, though a familiar tool, can be cumbersome for complex sales analyses.
If your organization is committed to using a legacy stack, Excel can be a viable starting point. For a structured, ready-to-use option, check out our CRM Excel Template. However, for more robust and scalable reporting, consider exploring modern sales analytics tools to streamline processes and ensure data accuracy.
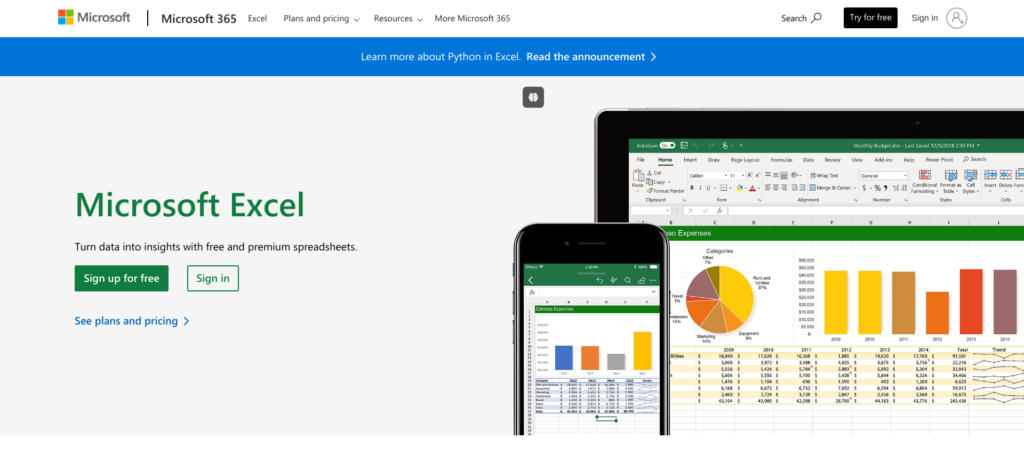
Here’s what sales reporting using Excel data looks like.
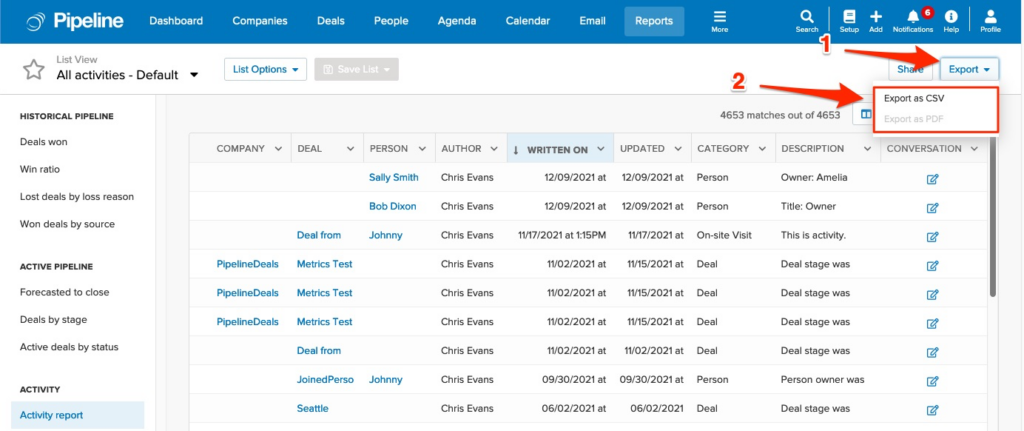
Your CRM sales reporting tool should include exporting to Excel-friendly options (e.g., CSV, TSV, XML, etc.). If you’re using Pipeline CRM, for example, you can export your data to CSV and PDF formats. Here’s how:
Companies, Deals, and People
- Select the columns and set your filters to the records you want to export
- Click on the Export button > Export as CSV or Export as PDF

Activities
- Navigate to the Reports tab > Activity Report
- Set your filters to display the activities you want to export
- Click on the Export button
- Select either Export as CSV or Export as PDF
Agenda
- Visit the Agenda tab
- Set your filters to display the tasks and events you want to export
- Click on the Export button
- Select either Export as CSV or Export as PDF

Exports
Please remember that your export will only include the columns that appear on the page. If you would like to customize the data included in the export, click Add/Remove Columns to adjust the columns in the view. Any column that is checked off will display on the page.
To learn more about filtering within columns, please visit the following link: Creating, Saving, and Sharing Custom List Views.
Power BI: Best for Self-Service Data Visualization and Analysis
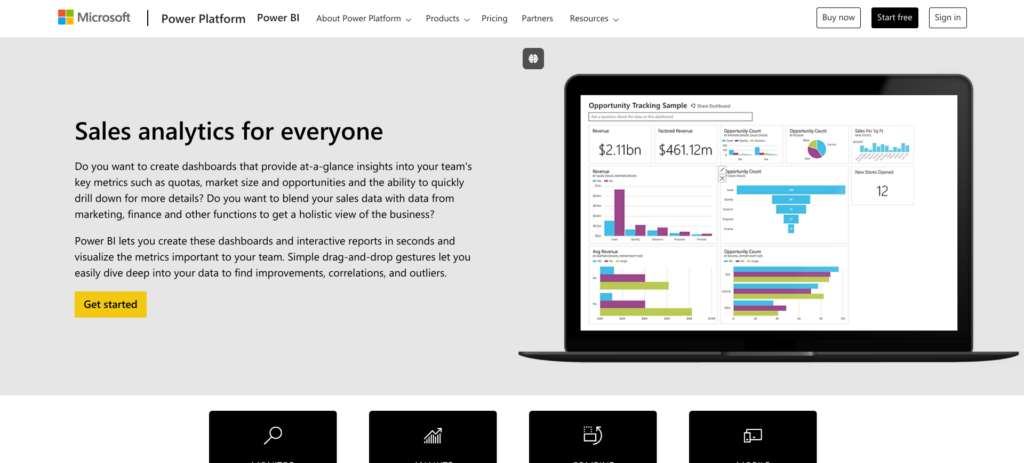
Power BI is a connector. It enables you to pull a large amount of data from various data sources in multiple formats. It’s free if you stay below the 1 GB data limit, it’s easy to use, reports are easier to share, and you can schedule an automatic data refresh.
Power BI goes beyond Excel by offering natural language querying. Simply ask your questions in plain English, and Power BI will use your data to provide insightful answers. For example, “What’s the total value of deals won/lost this year?”
It works with lots of data sources, including Pipeline CRM. That said, you have to feed your data into their system. It’s a house of cards. If anything goes wrong with your data sources, your insights may not be as reliable.
Sales Reporting in Power BI
Training with Excel is a helpful pre-requisite for working with Power BI.
There are lots of templates, formulas, and resources available for you to use with Power BI. Here’s an example showing you how to use Excel to create a sales dashboard in Power BI.
What about adding data sources in Power BI?
Tableau: Best Sales Analysis Tool for Generalists
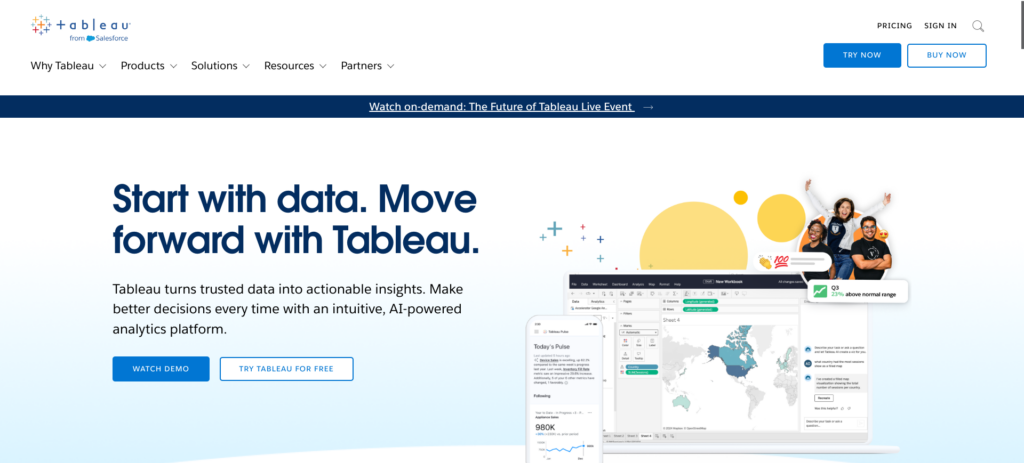
If you’re using Tableau, you can pull data from almost any database or data source. It’s designed to be user-friendly, create data visualizations via its drag-and-drop interface, and share insights in a few simple clicks. Their platform is AI-driven and designed to work with the tools and formats you’re already using.
However, there are some downsides. For instance, Tableau comes with a hefty price tag. Here’s a customer complaining about “the 100-user minimum for “Viewer” licenses and Data Management Add On that starts at ~$6,000 /100 users.” It’s a great product if you don’t mind spending to get the insights you need.
Sales Reporting in Tableau
Tableau’s product line includes embedded analytics, CRM analytics, Einstein Copilot, and data management products.
Here’s how you can make a sales dashboard in Tableau:
Wait a minute. You’ll need to get your data into Tableau first. How are you supposed to do that? Easy. Integration. You can integrate your Pipeline CRM and Tableau accounts with Zapier or Skyvia.
How Do You Use Sales Reporting To Increase Revenue?
If you want to use sales reporting to increase your revenue, the formula is simple.
Data (what) » Insights (why) » Action (how)
What does this look like in action?
| Data (what) | Our email open rate has decreased by 36%. |
| Insights (why) | CRM data shows that sales email strategies aren’t working as well. |
| Insights (why) | Customers consistently say they’re burned out by sales pitches. |
| Insights (why) | As a result, our sales email deliverability is down. |
| Action (how) | Share content that’s personalized, actionable, and very valuable. |
How do you put this into action? It’s a simple, six-step process.
- Choose a CRM or method for collecting sales data.
- Get buy-in from everyone on your team so they’ll use it.
- Collect data.
- Ask questions about that data to generate insights.
- Figure out how to address the issues raised by your insights.
- Take action.
These steps aren’t complicated. It just requires a little bit of discipline and lots of consistency. If your team is consistent about using your CRM or collecting sales data, you’ll have data you can draw insights from.
Once you have insights (questions), you’ll have what you need to find solutions and take action.
Why CRM Reporting Is Essential for Your Business
An analysis of your sales performance is important because it offers clear insights.
Sales analysis can tell you where you were, where you are, and where you’ll be.
Using the sales metrics and key performance indicators I’ve mentioned above, your sales team can ask (and answer) important questions about your team’s performance, such as:
- Is our lead response time improving or declining?
- Is our sales revenue increasing, stagnant, or decreasing?
- How many deals do we need to close (monthly, quarterly, annually) to hit performance targets?
- Have our win rates improved year-over-year?
- Have our close rates improved each month?
- How many of our sales reps meet their monthly quota?
- Which products are our most profitable?
- How much time do our reps spend selling and closing deals?
- Who are the rainmakers on our team? What are they doing differently?
- Which of our sales reps produces the most profit for our company?
The right data gives you the ability to answer important questions. These questions give your sales team the clarity you need to make important changes across your organization—how you train salespeople, the products that generate revenue vs. profit, your position in the marketplace, and more.
Track, Report, and Forecast Your Sales Performance with Pipeline CRM
As we’ve seen, most CRM initiatives fail to deliver on expectations. Organizations’ satisfaction with their current CRM solution tends to be low overall. In fact, the estimated failure rate is at 90%.
Organizations aren’t clear on the outcomes, metrics, and KPIs that matter to them. As a result, their lack of clarity means their desired outcomes are fuzzy, implicit, imprecise, or unrealistic. If they’re goal tracking, they’re focused on collecting more data. They should be focused on drawing insights from the data they already have.
Sales analysis provides a clear picture of your past, present, and future sales performance. With Pipeline CRM’s advanced sales reporting, you can easily filter data, create customized reports, and share insights with your team for informed decision-making.
Try out Pipeline CRM today for free for 14 days, and let us know what you think.

